
australian construction industry
News, Data, Trends & Analysis
From housing approvals and infrastructure investment to material costs, workforce trends and government policy, our Industry Insights page brings together the latest news, key statistics and expert analysis shaping Australia’s construction sector. Whether you’re a builder, developer, supplier, consultant, architect or industry professional, this page is designed to help you understand what’s happening across Australia’s residential, commercial and civil construction markets all in one place. Unlike a traditional news feed, this page is continually updated with the latest industry data, market trends and links to our most recent reporting, making it your go-to resource for understanding the Australian construction industry.
Industry Data Snapshot
Dwelling approvals: the leading indicator
Building approvals are the earliest widely available read on where residential construction is heading. An approval isn’t a home projects get delayed, redesigned or shelved but the direction of approvals tells you what the pipeline looks like six to eighteen months out.
The most recent ABS release shows total dwelling approvals fell 1.1% in May 2026 to 17,019 (seasonally adjusted), down slightly from April but up 5.3% on the same month a year earlier. The headline masks a sharp split by dwelling type: private house approvals rose 2.8% to 10,537, while private dwellings excluding houses — apartments, townhouses and other multi-unit — fell 10.4% to 6,034.
That split is the story worth watching. Detached housing has held up, with house approvals sitting above 10,000 for several consecutive months. The volatility is concentrated in higher-density approvals, where a single large apartment project approved or delayed can swing the national number.
What it means for builders: if you’re in detached residential, the pipeline read is steadier than the headlines suggest. If you’re exposed to medium- and high-density work, expect lumpier demand and plan cash flow accordingly.
Material Costs
Material costs are no longer the story they were in 2022 and 2023 — but the calm is uneven, and it may not hold.The ABS Producer Price Index shows the cost of materials used in house construction rose just 1.6% over the March 2026 quarter, a world away from the double-digit surges that pushed hundreds of fixed-price builders into loss. The relief is real in the categories that hurt most last cycle: timber, board and joinery fell 3.6%, and steel products eased 0.9%. Concrete, cement and sand barely moved at 0.6%. On paper, that reads like a sector finally finding a stable footing.
But the average conceals where the pressure has shifted. Electrical equipment climbed 5% over the same quarter the standout outlier at a time when trades are already the tightest constraint on site and electricians are the one occupation the market isn’t short of. For builders, the takeaway isn’t that costs have stopped moving; it’s that they’ve stopped moving together. Pricing a job off a single headline escalation figure now risks getting the mix wrong: under-provisioning for the electrical and services trades while over-hedging on framing timber that’s actually come down. The bigger risk sits upstream of these numbers entirely. The March quarter predates the fuel and freight pressure flagged in the NHSAC’s 2026 outlook, and categories tied to oil, PVC, polyethylene, anything shipped are the ones most exposed if that pressure feeds through. The current quarter is the one to watch, not the one just reported.
Builder insolvencies
The construction industry is one of Australia’s largest and most important economic sectors, supporting communities, driving infrastructure investment and delivering the homes, workplaces and public facilities the nation depends on. The sector includes thousands of businesses across residential building, commercial construction, civil engineering, infrastructure, specialist trades, manufacturing and building products. Together, these businesses employ more than one million Australians and contribute significantly to the nation’s economic growth each year. As market conditions evolve, factors such as population growth, housing demand, labour availability, government investment and economic policy continue to influence activity across the industry. The Good Builder monitors these changes every day, providing builders and construction professionals with independent reporting, expert commentary and practical insights that matter.
latest news

Goop Guys Names Mark Sutton General Manager. He Says Surface Protection Is a Risk Decision, Not a Cost Line.
The new general manager of the Sunshine Coast surface protection business has spent a career in hardware, paint and building products. His first read on the market is that builders skipping protection are not cutting costs. They are taking a bet. A $5,000 bathtub gets...
Tasmania Has Drafted Australia’s First Modular Housing Finance Law. The Approved Builder List Will Be Public.
The consultation draft runs to twelve sections and leaves every number to regulations that have not been written. Two things are already fixed in the drafting, and both raise questions worth putting in a submission before 4 September. Tasmania released the...

GRAYA Wins Approval for Silk at St Lucia. Genuine Riverfront Sites in the Suburb Are Now Almost Exhausted.
A 22 residence building on a bend of the Brisbane River has cleared development assessment. The detail worth noting sits in how the approval was assessed, not in the architecture. GRAYA has development approval for Silk, a 15 level residential building on the Brisbane...
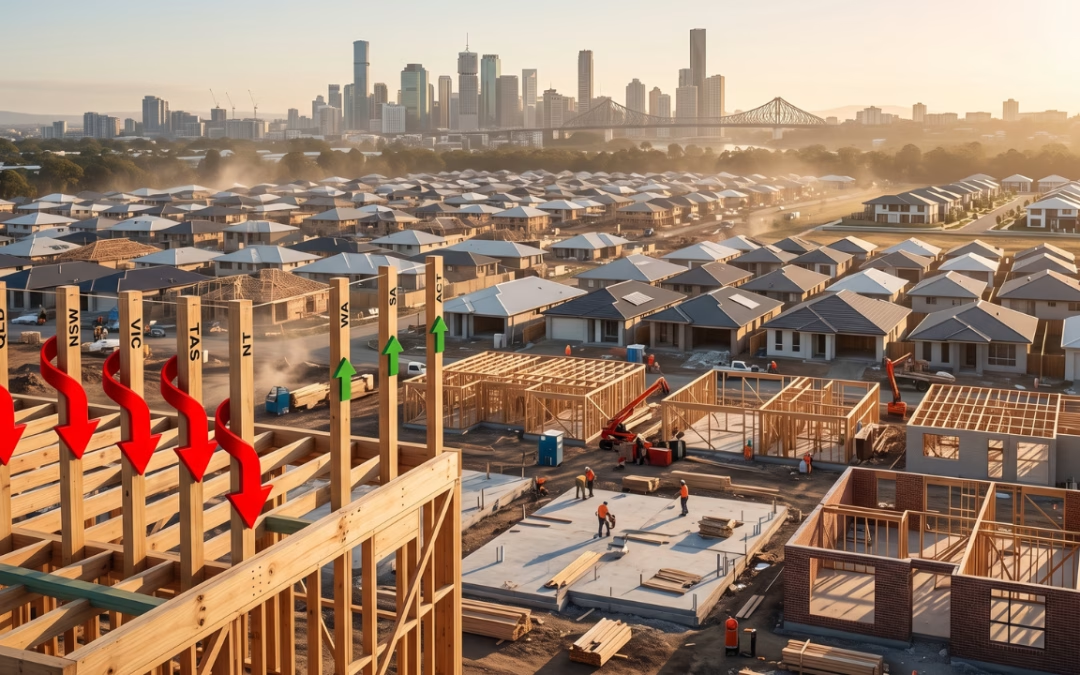
Australia Has a Record Number of Homes Under Construction. Completions Just Went Backwards in Five of Eight Jurisdictions.
The National Housing Supply and Affordability Council’s August Quarterly Report pushed the 1.2 million target back another quarter. The number that matters more to most home builders is sitting in the ABS data underneath it. The National Housing Supply and...

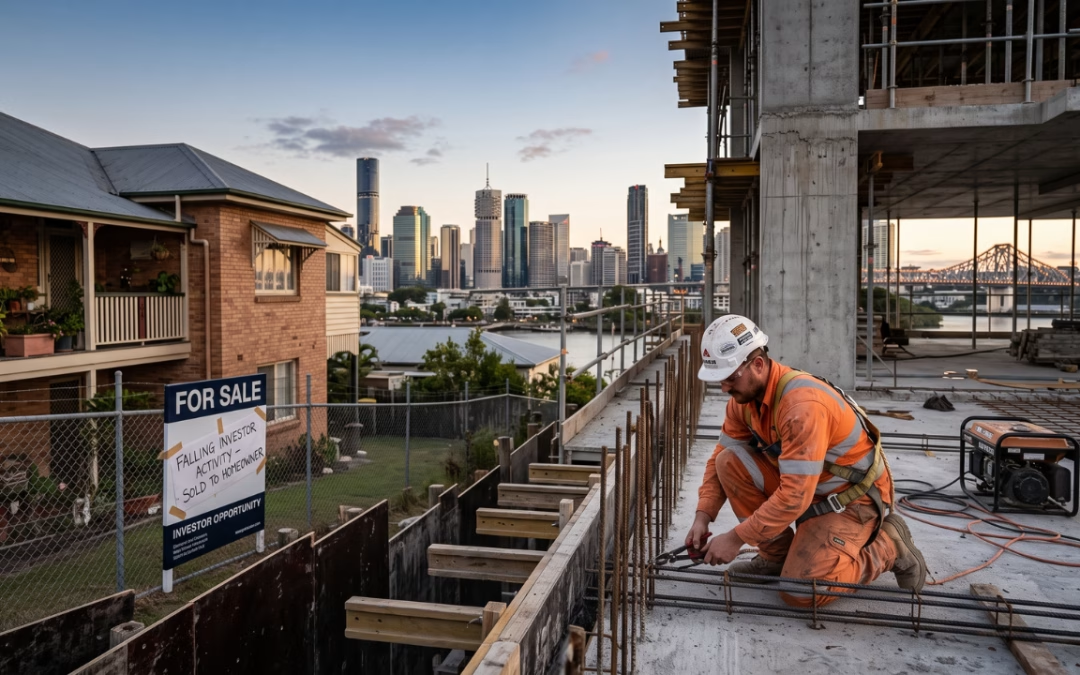
Investor Construction Lending Hit a Series High Last Quarter. The Fall in Investor Activity Came Entirely Out of Established Housing.
Investors took out more loans to build new homes in the June quarter than in any quarter the ABS has on record. Over the same three months, investor lending overall went backwards. The gap between those two facts is where the story sits. Australian investors took out...

Brisbane Cuts Its Minimum Lot Size to 120 Square Metres. The Number That Actually Changes the Job Is 180.
The headline number is the smallest freehold lot Brisbane has ever allowed. The operative number sits sixty square metres above it, and it moves a design decision from the builder to the subdivider. Brisbane City Council has signed off on the biggest change to its...
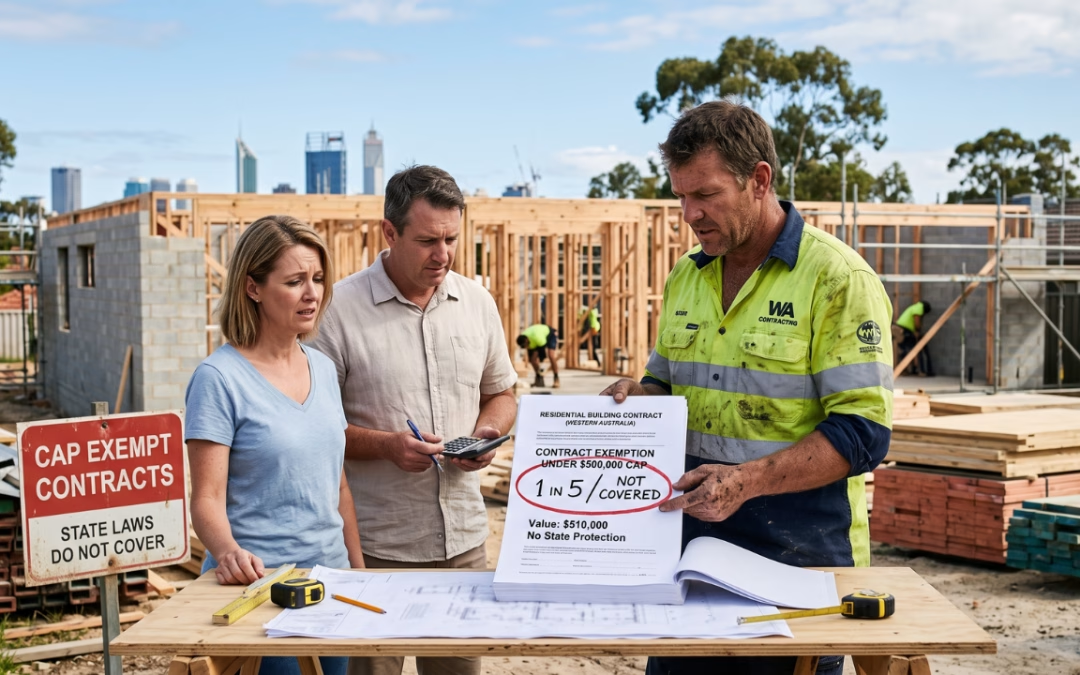
Western Australia Is the Only State That Caps Which Home Building Contracts Its Laws Cover. Nearly One in Five Now Falls Outside.
The ceiling has not moved since 2007. Building costs have. A government discussion paper now proposes lifting it to $800,000, with the recommendations report due next month. Western Australia's Home Building Contracts Act 1991 does not apply to every home building...
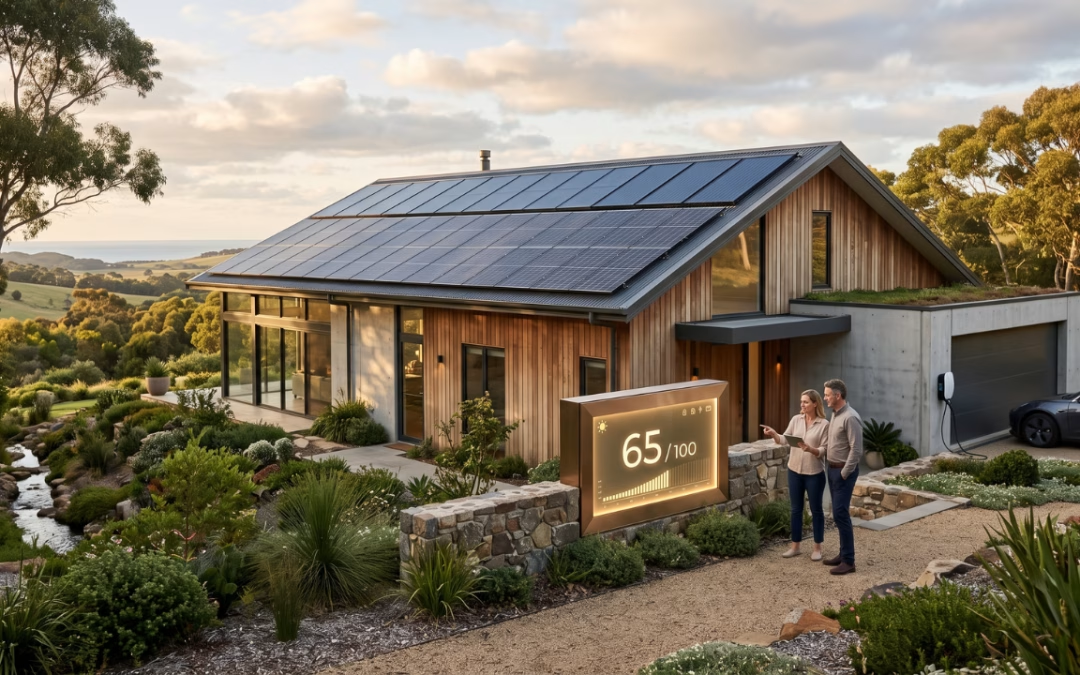
A Home That Powers Itself Now Has a Score. The Code Minimum Is 60 Out of 100.
Self powering homes are being pitched as the next step for Australian housing. The rating tool that measures them is already sitting on every new build certificate, and most builders have never looked at the number. Last updated: August 2026 A home that generates more...
MORE NEWS

Every State Requires the Variation Document Before the Work Starts. What Happens If You Skip It Splits Three Ways.
Two states can take the money off you. Three treat it as an offence and leave the contract standing. And South Australia does something different again, which may be the sharpest of the lot. In all six Australian states, residential building legislation says the same...

The RBA Has Dwelling Investment Going Backwards From Late 2027. Its Own Liaison Notes Explain Why.
The August Statement on Monetary Policy carries a residential construction forecast that went almost entirely unreported. The number matters less than the mechanism the Reserve Bank describes underneath it. The Reserve Bank's central forecast has dwelling investment...

Builders, Manufacturers and Government Meet on Timber and MMC Next Month. Here Is What the Program Says About WA’s Progress.
Western Australia has spent two years funding the manufacturing base for offsite housing. A full day of sessions at Crown Perth on 16 September is a useful place to read how much of the rest of the system has caught up. Western Australia is further into the shift...

Victoria’s Draft Rules Double the Builder Deposit to 10 Per Cent. The Bigger Change Is That the Payment Schedule Can No Longer Be Varied.
Draft regulations released for consultation would lift the maximum deposit on a standard house build from 5 per cent to 10 per cent, add a site preparation stage, and remove the ability to agree a different payment schedule. Submissions close 16 September. The...
Stay informed with our latest Industry Reports…

The Top 100 Queensland Builders Report
The cheap end fell away. The average climbed. Nobody added 11% to every quote. The market moved upmarket instead.
Sub-$400k builds fell 54% in a single year. The $750k-and-above tier grew 43%, the fastest move in the market. Fewer homes under $500k, more homes above it, and the blend did the rest.
Here is the part worth paying attention to: materials did not do this. We tested the 11.3% rise in the average contract against real Australian cost data over the same window. The most generous cost-push figure is about 4%. Roughly two-thirds of the increase is product mix and pricing, not costs passed through.
If you are quoting, buying land, or supplying this market, that distinction changes your read of everything.

Australian Construction Industry Health Report
Australia’s building and construction industry enters 2026 in a state of tension. Demand is structurally strong. The industry’s ability to deliver is not. This report gives you the complete picture; insolvency data, cost trends, workforce shortfalls, consumer sentiment, land pipeline and prices, interest rates, and government policy all in one place.
This report brings together data from more than a dozen authoritative sources; including the ABS, ASIC, Westpac-Melbourne Institute, HIA, Master Builders Australia, RLB, openlot.com.au, the QBCC and more to give you a clear-eyed view of where the industry stands and what’s coming.
Building Activity and Approvals – Construction Costs – Customer Sentiment and Experience – Land Supply and Pricing – Builder Insolvencies – Workforce and Skills – Interest Rates and Borrowing Capacity – Sub-Constractor and Supply Chain Health – Government Policy and Incentives – Iran Conflict and Supply Chain Risk.