


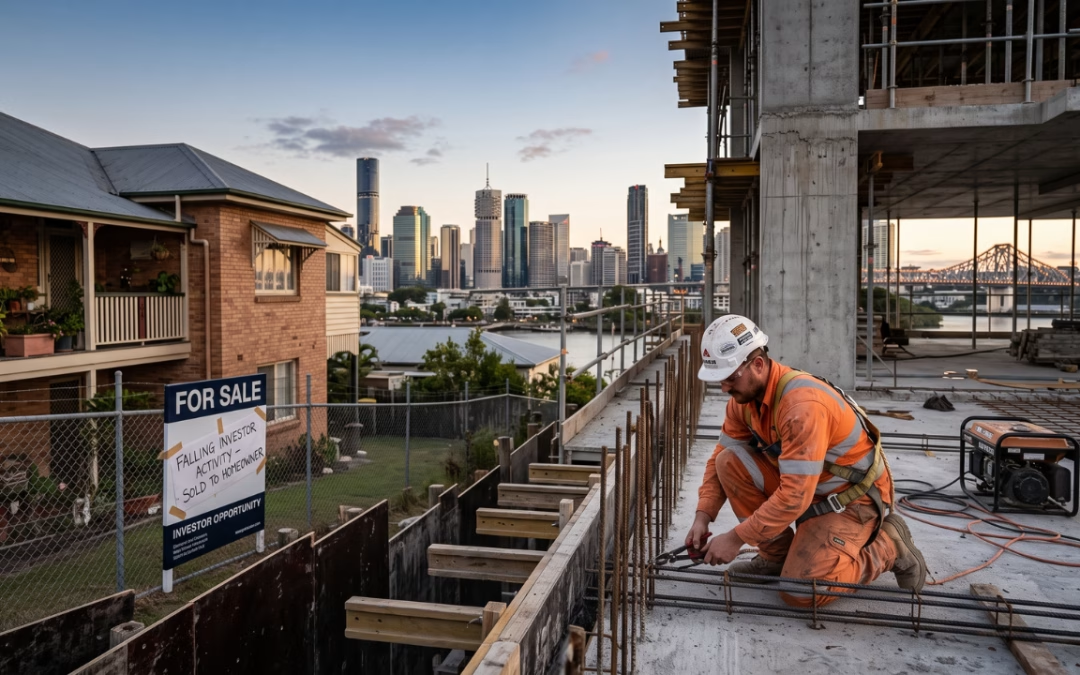
Investors took out more loans to build new homes in the June quarter than in any quarter the ABS has on record. Over the same three months, investor lending overall went backwards. The gap between those two facts is where the story sits.
Australian investors took out 8,468 new loan commitments for the construction of dwellings in the June quarter of 2026, seasonally adjusted. That is the highest quarterly figure in the ABS Lending Indicators series, which begins in the September quarter of 2019. Over the same three months, total investor loan commitments for dwellings fell 8.6 per cent to 52,599, and lending for the purchase of established dwellings fell 14.8 per cent.
So the quarterly fall in investor activity did not come out of new construction. It came out of established housing. New build lending moved in the opposite direction to the market it sits inside.
What the June quarter data shows
All figures below are seasonally adjusted, drawn from Table 13 of the ABS Lending Indicators release for the June quarter of 2026.
Loans for the construction of dwellings: 8,468. Up 4.4 per cent on the March quarter and 20.2 per cent on the same quarter last year.
Value of those commitments: $5.99 billion. Up 6.3 per cent on the quarter and 26.4 per cent on the year. Also a series high.
Loans for the purchase of newly erected dwellings: 2,455, up from 2,368.
Loans for the purchase of established dwellings: 40,647. Down 14.8 per cent on the quarter and 1.5 per cent on the year.
Total investor loan commitments for dwellings: 52,599. Down 8.6 per cent on the quarter, but up 2.8 per cent on the year.
Two comparisons are running at once there, and they point different ways. Measured quarter on quarter the investor market shrank. Measured year on year it is slightly larger than it was twelve months ago. Construction lending is up on both measures. Established lending is down on both.
On a rolling four quarter basis, investor construction commitments reached 31,837, against 30,411 for the preceding four quarters. That is also a series high, and it smooths out the quarterly noise.
Construction lending now accounts for 16.1 per cent of all investor loan commitments for dwellings, up from 14.1 per cent in the March quarter. That share is the highest in the series.
A loan to buy an established home creates a transaction. A loan to build one creates a job.
Why the split matters more than the total
Read only the headline number and the June quarter looks like investors stepping back. For anyone whose work depends on dwellings actually being built, that reading is close to useless.
A loan to buy an established home changes who owns a house that already exists. A loan for construction funds a slab, a frame, a roof and everything that follows. Those two things sit in adjacent columns of the same ABS table and mean entirely different things on a site.
Housing finance also sits early in the chain that runs through approvals, commencements and completions. A shift visible in lending data now is a shift that shows up in activity data considerably later. Builders reading the starts figures are reading a picture that has already moved.
The forecast this data lands against
Two weeks after the May budget, Westpac published a revised housing forecast. Its economics team expected new investor activity to fall by around 34 per cent, driven by the combination of the tax changes and rising interest rates. But it also expected the mix inside that smaller pool to shift hard toward new construction, with the new build share of investor finance rising from about 20 per cent to around 40 per cent, and rising in absolute terms even as total investor activity fell. Over the medium term the bank put the eventual lift in new dwelling construction in the order of 15,000 to 30,000 dwellings a year.
Westpac set its starting point at 18 per cent of new investor finance approvals going to the construction or purchase of newly built dwellings. The ABS March quarter figure was 18.2 per cent, so the baseline holds.
In the June quarter, construction plus purchase of newly erected dwellings came to 10,923 commitments, or 20.8 per cent of all investor commitments. The share moved roughly two and a half percentage points in a single quarter, in the direction Westpac forecast.
Worth noting: that combined share is not a record. It reached 22.4 per cent in the June quarter of 2020, during the HomeBuilder period. Only the construction component is at a series high.
Treasury’s modelling points the other way. Its published explainer states that slower house price growth will have a small impact on housing supply, more than offset by the other housing measures in the budget. The figure widely reported at budget time, and attributed to Treasury modelling, was around 35,000 fewer homes over a decade. Westpac’s own note observes that it is unclear how well that modelling captures the carve out for new builds at all.
One quarter of lending data does not settle an argument about a decade. It is, however, the first hard reading either side has had.
Where the growth is showing up
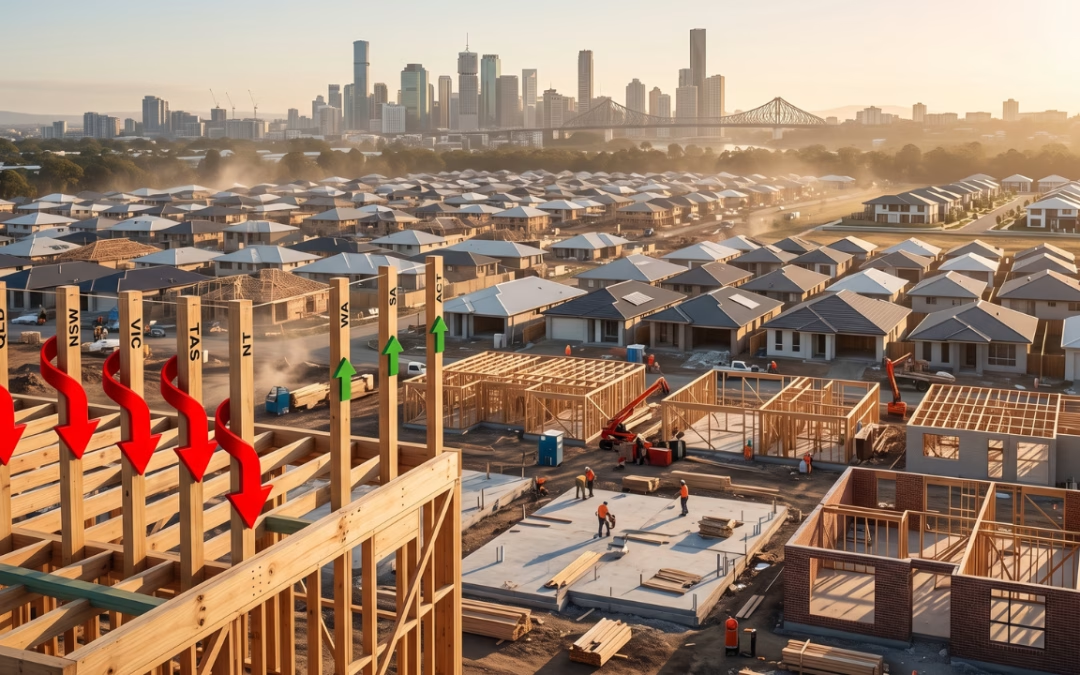
State level series are published in original terms rather than seasonally adjusted, so the year on year comparison is the one that works. Investor loans for the construction of dwellings, June quarter 2026 against June quarter 2025:
South Australia: 693, up 30.3 per cent
Queensland: 2,007, up 28.2 per cent
New South Wales: 1,810, up 17.8 per cent
Western Australia: 1,309, up 13.8 per cent
Victoria: 2,817, up 13.1 per cent
Nationally the original series shows 8,867 commitments, up 20.3 per cent on the year. South Australia and Queensland are both running well ahead of that national rate. Victoria remains the largest single state by volume, but it is growing at roughly half Queensland’s pace.
What the June quarter does not prove
The series is short
The ABS quarterly series begins in the September quarter of 2019. A series high here means a seven year high. It is not an all time record, and anything describing it as one is overreaching.
Only part of the quarter was post budget
Budget night was 12 May. Around seven weeks of the June quarter followed it, and a loan commitment is typically recorded weeks after the buying decision was made. The June quarter is a partial reading of post budget behaviour, not a complete one.
Interest rates moved at the same time
The RBA raised the cash rate three times in the first half of 2026. Higher rates hit established purchase and new construction differently, and they hit investors and owner occupiers differently again. A single quarter cannot separate the tax effect from the rate effect.
There is also a third policy variable now in the mix. The SMSF residential borrowing ban commenced on 10 August, inside the current quarter, and unlike the negative gearing and capital gains changes it contains no carve out for new builds. Whatever the September quarter shows will carry that alongside everything else.
A loan commitment is not a start
Finance approval sits ahead of contract, ahead of approval and a long way ahead of a slab. Some of it converts slowly. Some of it does not convert at all. Lending data is a leading indicator, which makes it useful, and a leading indicator is not a delivery number.
What this means for the pipeline
If the shift holds, what changes is the composition of investor demand rather than its volume. That points toward house and land, greenfield product, small lot detached housing and apartments, and away from established stock. It is a different product mix, sold through different channels, on different timelines.
The eligibility definition matters here and is frequently misunderstood. The negative gearing carve out applies only to dwellings that genuinely add supply. A one for one knock down rebuild does not qualify unless the site is subdivided and more dwellings result. A brand new house is not automatically a new build for tax purposes.
The next reading is the one to watch. The September quarter release, expected in November, will be the first full quarter of post budget behaviour, with no pre budget weeks diluting it.
The headline number in the June quarter reads as investor retreat. The composition reads as redirection. For anyone whose income depends on new dwellings being built rather than resold, the second reading is the one with money attached to it.
Frequently asked questions
There were 8,468 new investor loan commitments for the construction of dwellings in the June quarter of 2026, seasonally adjusted. That is up 4.4 per cent on the March quarter and 20.2 per cent on the same quarter a year earlier, and it is the highest quarterly figure in the ABS Lending Indicators series, which begins in the September quarter of 2019. The value of those commitments was $5.99 billion, also a series high.
Both, depending on the comparison. Total investor loan commitments for dwellings fell 8.6 per cent on the March quarter, to 52,599. Measured against the June quarter of 2025, the same figure is up 2.8 per cent. The quarterly fall was concentrated entirely in lending for established dwellings, which dropped 14.8 per cent. Lending for construction and for newly erected dwellings both rose.
It is consistent with them, but a single quarter cannot prove it. The budget was handed down on 12 May, so only around seven weeks of the June quarter followed it, and loan commitments lag buying decisions. The RBA also raised the cash rate three times in the first half of 2026, which affects investor behaviour independently. The September quarter, being the first full post budget quarter, will be a cleaner reading.
On a year on year basis in original terms, South Australia leads at 30.3 per cent growth, followed by Queensland at 28.2 per cent, New South Wales at 17.8 per cent, Western Australia at 13.8 per cent and Victoria at 13.1 per cent. The national increase was 20.3 per cent. Victoria still records the largest raw volume at 2,817 commitments, ahead of Queensland at 2,007.
No. The carve out applies only to dwellings that genuinely add to housing supply. A one for one knock down rebuild does not qualify unless the site is subdivided so that more dwellings result. Nor does the concession carry to a subsequent purchaser: once the original investor sells, the property is treated as established for tax purposes. This distinction has direct consequences for how new work is presented to investor buyers.
Sources: Australian Bureau of Statistics, Lending Indicators, June quarter 2026 (Tables 13 and 15 to 19). Westpac IQ, Housing forecast update, 26 May 2026. Australian Government, Negative Gearing and Capital Gains Tax Reform tax explainer, Budget 2026 to 27.
General information disclaimer: This article is general information for industry professionals and reflects data available at the date of publication. It does not constitute financial, taxation, legal or investment advice, and it does not take account of any individual’s circumstances or objectives. Statistical figures are subject to revision by the issuing agency. Readers should obtain independent professional advice relevant to their own situation before making any business or financial decision.



0 Comments