


Australia has more industrial land on the books than it has had in years. It also has less land that anyone can actually build on.
Both things are true at once, and the gap between them is the story.
New research from Cushman and Wakefield, published as The Industrial Land Shift, found identified industrial land supply across the five major capitals rose from roughly 9,600 hectares to 12,577 hectares over the past year. Over the same period, the land classed as development ready fell by about 5 per cent, to 3,365 hectares.

The pipeline got bigger. The buildable share of it got smaller.
Three numbers, not one
The research sorts land into tiers, and the distinction matters more than any single headline figure.
Identified supply is 12,577 hectares. That is every hectare of vacant industrial land counted across Sydney, Melbourne, Brisbane, Perth and Adelaide.
Active supply is 3,365 hectares, or about 27 per cent of that total. Active means the site is serviced now, or is expected to be serviced within two years.
Developer controlled active supply is 2,337 hectares. That is 70 per cent of active land, and under 20 per cent of the identified pipeline.
The last figure is the one that drives delivery. Set against national absorption of 730 hectares a year on a five year average, it leaves about 3.2 years of land in the hands of the groups most likely to develop it.
Zoned is not the same as serviced
The report is direct about the cause. The constraint is not the availability of zoned land. It is the delivery of serviced land: roads, power, water, sewer and telecommunications, along with subdivision and the planning coordination that sits behind all of it.
The lead times set out in the research show the size of that gap.
In New South Wales, a site that is already zoned and serviced can be delivered in roughly 1.5 to 2.5 years. The same site zoned but unserviced runs to between three and six years. Unzoned and unserviced, it is six to 10 years.
Queensland runs 1.5 to two years, three to four years, and five to seven years across those same three categories. Victoria runs 1.5 to two, two to four, and four to eight. Western Australia and South Australia both stretch past seven years at the unzoned end.
So a rezoning announcement and a buildable site can be the better part of a decade apart. The headline pipeline figure and the deliverable figure are measuring two different things.
Absorption is faster, and lumpier
Demand has not waited for any of this.
National absorption reached 899 hectares in 2025, the equal strongest year on record and about 42 per cent above the 10 year average of 635 hectares. Brisbane set an outright record at 171 hectares, more than double its own 10 year average. Perth recorded 95 hectares against an average of 61. Adelaide reached 65 hectares against an average of 55. Melbourne recorded the highest absorption of any city.
The shape of demand has changed as well. A single forward commitment now regularly takes 15 to 20 hectares out of the market. A decade ago the average was closer to three hectares.
That is the mechanical problem underneath the numbers. Land leaves the active pool in large blocks and comes back into it slowly, one servicing program at a time.
Data centres are bidding for the same ground
The other change is who is buying.
Since 2018, data centre operators have acquired roughly 710 hectares of industrial land across Sydney and Melbourne. Cushman and Wakefield estimates those acquisitions have removed around 3.5 million square metres of future warehouse capacity from the market. Since 2024, the average data centre lot has been 26.5 hectares.
In 2025, data centres accounted for about 17 per cent of national land absorption, and about 27 per cent across Sydney and Melbourne combined.
They also buy on different terms. Site selection is driven primarily by access to power capacity rather than transport infrastructure, and the pricing follows. Across Sydney transactions since 2020, data centre operators paid about 67 per cent more than developers and owner occupiers for raw and zoned land, about 42 per cent more for zoned and serviced land, and about 35 per cent more for land that was zoned, benched and serviced.
There is a second effect worth watching. As those transactions become an established part of the market, they lift statutory land values. The research estimates recent Sydney and Melbourne sales could contribute to statutory land value increases of more than 10 per cent a year over the next three years in key precincts. Statutory values drive land tax and council rates, and those are fixed costs for every business operating in the precinct.
The runway varies by city
The national average hides a wide spread. Adelaide is the most constrained market in the country. Perth has the longest runway.
| City | Active supply (ha) | Developer controlled (ha) | Years of supply remaining |
|---|---|---|---|
| Adelaide | 159 | 85 | 1.5 |
| Sydney | 829 | 661 | 2.9 |
| Brisbane | 700 | 383 | 3.1 |
| Melbourne | 1,258 | 903 | 3.5 |
| Perth | 420 | 305 | 4.7 |
| National | 3,365 | 2,337 | 3.2 |
Years remaining is calculated on developer controlled active supply against each market’s five year average annual absorption. Source: The Industrial Land Shift, Cushman and Wakefield, Q3 2026.
Brisbane recorded the sharpest fall, with development ready supply down about 25 per cent over 12 months as absorption, estate sell downs and the reassessment of previously identified sites reduced the pool. Sydney held broadly steady at 829 hectares despite heavy absorption, because new land progressed into the development ready pipeline behind it. Melbourne holds the largest active stock nationally at 1,258 hectares, although roughly 1,300 hectares of the pipeline in Melbourne’s West cannot be delivered until 2032 at the earliest.
Concentration is the other feature. Five submarkets account for 65 per cent of the national active land stock. Established infill precincts, the ones closest to labour and customers, hold less than 15 per cent.
Why this lands on residential sites
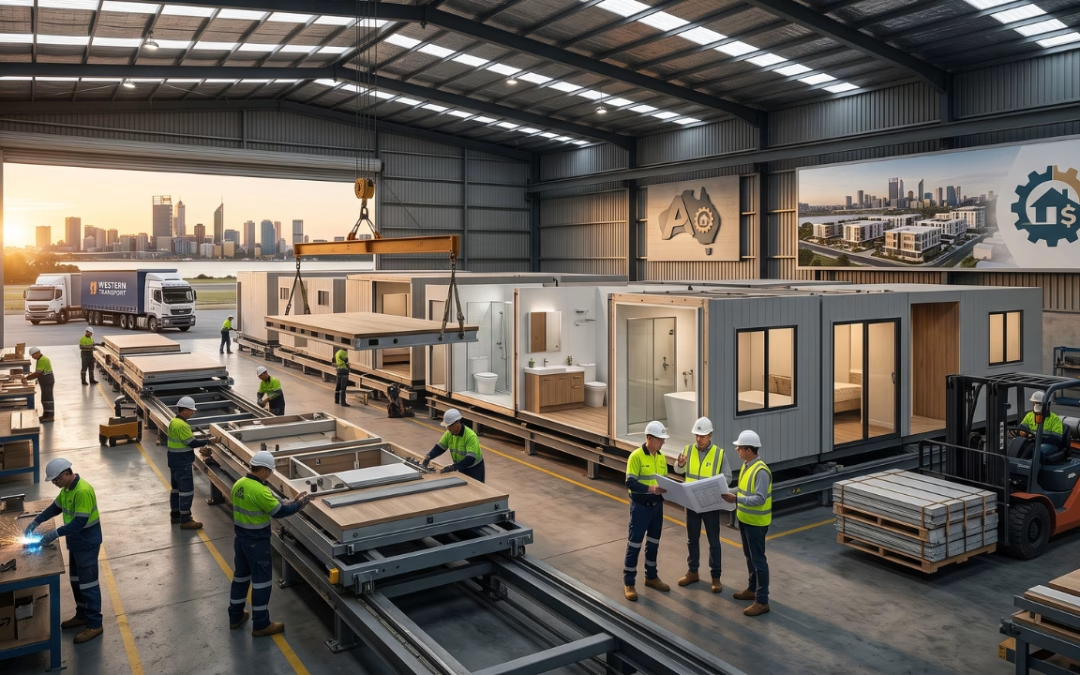
Industrial land is where the residential supply chain physically lives. Frame and truss plants. Batching plants. Window and door fabricators. Distribution centres. Laydown yards for precast panels.
When serviced land gets scarcer and more expensive, the operating cost of those businesses moves with it, and it tends to move in one direction. Rates and land tax follow statutory values. Those are fixed costs, and fixed costs get built into supplier pricing long before they show up on a quote.
There is a capacity overlap as well. Servicing works are civil works: earthworks, headworks, trunk infrastructure, power connections. The crews and contractors doing that work in growth corridors are largely the same ones residential subdivisions depend on.
Then there is the structural point, which is the most useful part of the whole report, and it reads across to residential land almost perfectly. A rezoning is not a lot. An approval is not a serviced block. The number that determines what actually gets built is the serviced number, and it is rarely the number in the announcement.
What the market does next
Capital has not lost interest. Around $9 billion of industrial land transactions above $10 million have traded nationally since the start of 2024, with established groups including Goodman, Dexus and ESR active alongside newer entrants such as LogiSPACE.
Pricing has split into two tiers. Sites capable of supporting development within two years are attracting the strongest competition, and the research records the widest pricing gap it has seen between near term development sites and longer dated pipeline land.
The expected response is more infill and brownfield redevelopment, particularly where a site carries holding income while the servicing question gets worked through.
The Good Builder take
Australia does not have an industrial land shortage on paper. It has a servicing shortage in practice.
The pipeline grew by almost a third over 12 months and the buildable share of it still went backwards. That is not a planning failure so much as a sequencing one, and it is the same sequencing problem sitting under residential land supply.
The measure that counts is not how many hectares have been zoned. It is how many have power, water and a road to them.
Frequently asked questions
Identified supply counts all vacant industrial land, whether or not it can be developed soon. Active supply is the subset that is serviced now or is expected to be serviced within two years. In the Cushman and Wakefield research, identified supply nationally is 12,577 hectares while active supply is 3,365 hectares, so roughly three quarters of the headline pipeline cannot support near term development.
Nationally there are 3,365 hectares of active industrial land, of which 2,337 hectares is controlled by developers. Measured against a five year average absorption rate of 730 hectares a year, that equates to about 3.2 years of developer controlled supply. The figure ranges from about 1.5 years in Adelaide to about 4.7 years in Perth.
Zoning establishes what a site can be used for. It does not deliver the roads, power, water, sewer and telecommunications a site needs before construction can start, and it does not complete subdivision. The research puts the gap between a zoned unserviced site and a buildable one at three to six years in New South Wales and three to four years in Queensland. For unzoned land, the range runs to 10 years.
Data centre operators have bought around 710 hectares across Sydney and Melbourne since 2018, which Cushman and Wakefield estimates has removed about 3.5 million square metres of future warehouse capacity. They accounted for roughly 17 per cent of national land absorption in 2025. Because they select sites on power capacity, they compete hardest for the same serviced parcels industrial developers want, and they have paid premiums of between 35 and 67 per cent on Sydney transactions depending on how far the land had progressed.
The businesses that supply residential construction operate from industrial land: fabricators, batching plants, distribution centres and storage yards. Scarcer and more expensive serviced land raises their occupancy costs, and rising statutory land values raise their rates and land tax. Those costs are fixed, so they tend to be absorbed into supplier pricing. Servicing works also draw on the same civil contractors that residential subdivisions rely on.
Related reading
Australian Construction Industry Trends Guide
Source: The Industrial Land Shift, Cushman and Wakefield, Q3 2026.
General information only. This article does not constitute financial, legal or professional guidance. Readers should seek independent guidance suited to their specific circumstances.

Author: TGB Editorial



0 Comments