


The latest ABS data shows residential and non-residential building activity both growing at their strongest annual pace in years. What the December quarter figures reveal about where the industry is heading, and where the pressure points remain.
The headline numbers from the Australian Bureau of Statistics are worth pausing on.
Total building work done in Australia reached $44.1 billion in the December quarter of 2025, up 0.9 per cent from the September quarter and 8.1 per cent higher than the same period the previous year.

Residential building led the charge, rising 1.0 per cent over the quarter to $27.1 billion. Annual growth in residential building now sits at 8.0 per cent. Non-residential building was not far behind, up 0.7 per cent for the quarter and 8.2 per cent year on year.
These are not incremental moves. An 8 per cent annual lift in building activity represents a meaningful acceleration, and for builders navigating what has been a difficult few years, it is a signal worth understanding.
What the Trend Line Is Telling Us
The ABS publishes two measures for these figures: seasonally adjusted estimates and trend estimates. The seasonally adjusted figure captures the quarter-to-quarter movement once the usual patterns of the calendar are stripped out. The trend estimate smooths further, removing short-term volatility to show the underlying direction of travel.
Both measures are pointing in the same direction.
The trend estimate for total building work done rose 2.4 per cent in the December quarter alone, with residential up 2.3 per cent and non-residential up 2.4 per cent. Over the year, the trend figures for both residential and non-residential building landed at 8.3 per cent and 8.1 per cent respectively.
When seasonally adjusted and trend measures are aligned and both accelerating, it tends to signal that activity is genuinely picking up rather than bouncing off a single one-off event. That is the picture the December quarter data presents.
Residential building work done is 8 per cent higher than at the same time last year. When seasonally adjusted and trend measures both point the same direction, the signal is hard to ignore.
The Engineering Side of the Ledger
Not all the data was positive. Engineering construction, which covers infrastructure including roads, pipelines, mines, and utilities, fell 1.3 per cent in seasonally adjusted terms during the December quarter. Year on year, engineering activity is down 2.7 per cent.
For most residential builders, engineering construction is not the day-to-day concern. It is, however, relevant to the broader supply picture. Infrastructure projects compete for the same trades and materials that residential builders rely on. When engineering activity pulls back, it can ease some of that competition.
The trend estimate for engineering tells a more nuanced story, showing a modest 0.5 per cent rise for the quarter despite the seasonally adjusted dip. The short answer is that engineering construction appears to be softening from its recent peak, while building work continues to grow.
The State-by-State Picture
The national aggregate figures tell one story. The state breakdown adds texture.
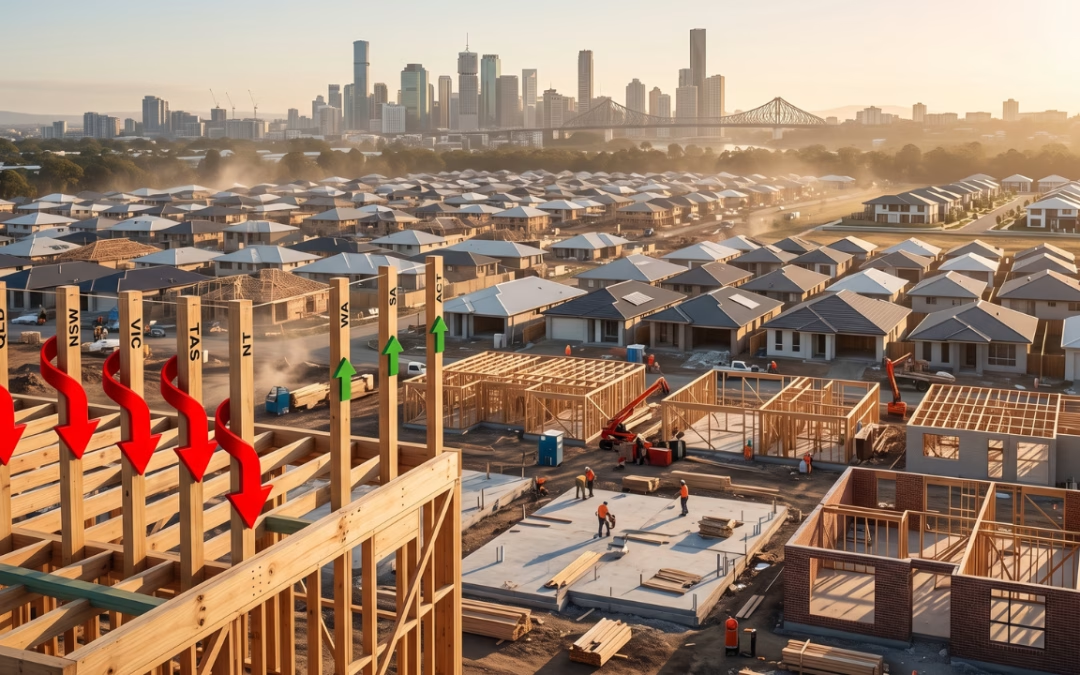
New South Wales posted a 1.5 per cent rise in total construction work done during the December quarter, with annual growth of 3.4 per cent. Victoria grew 0.9 per cent for the quarter, matching its annual growth rate. South Australia was the standout performer, up 2.3 per cent for the quarter and a striking 19.9 per cent over the year.
Queensland dipped 1.1 per cent for the quarter but remains 6.4 per cent higher than a year ago. Western Australia fell 1.7 per cent for the quarter and is marginally lower year on year, down 1.9 per cent. The Northern Territory recorded the sharpest fall at 11.4 per cent for the quarter.
South Australia’s annual growth rate of nearly 20 per cent stands out as an outlier and will warrant watching in coming quarters to see whether it reflects a structural shift or is being driven by specific project activity.
For builders, the state breakdown is a reminder that national aggregates can mask meaningfully different conditions at a local level. A builder in South Australia is operating in a very different environment to one in Western Australia right now.
South Australia posted annual construction growth of 19.9 per cent. New South Wales and Victoria are growing steadily. The national average does not tell the whole story.
Where This Sits in a Longer Context
To understand the December quarter figures properly, it helps to place them in a longer time frame.
Looking at the ABS data series going back to late 2017, residential building activity has been on a gradual recovery path since bottoming out around mid-2022. At that point, seasonally adjusted residential building work had fallen to roughly $23.3 billion per quarter. By December 2025, that figure had recovered to $27.1 billion. That is a meaningful rebuild, though it is worth noting that residential activity in 2017 and 2018 was already sitting at levels in the $26-27 billion range before the COVID-era disruptions.
The current residential building figure is not unprecedented territory. What is notable is the trajectory, the pace of recovery, and the consistency of the trend.
Non-residential building presents a different picture. The December quarter figure of $17.0 billion is close to the highest level in the data series and reflects sustained activity in commercial, industrial, and institutional construction.
What This Means for Builders
Rising building activity is, broadly, good news for the construction sector. More work getting done means more pipeline, more trade activity, and more revenue moving through the system.
But builders have learned, sometimes painfully, that high activity does not automatically translate to healthy businesses. The COVID and HomeBuilder period showed how quickly a demand surge can overwhelm capacity, inflate costs, and create delivery problems that damage reputations and strain cash flows.
The question for builders in this environment is not simply whether there is work available. It is whether they are positioned to take it on sustainably.
Capacity constraints remain real. Labour shortages in key trades have not disappeared. Material costs, while stabilising in some categories, have not returned to pre-2021 levels. And the project pipeline that has been building through approvals data over recent quarters will continue to convert into site starts through 2026.
Builders who are managing capacity carefully, pricing jobs to account for current cost structures, and maintaining strong cash flow discipline are well placed. Those who stretch beyond their operational limits to capture market share risk repeating the mistakes of the boom years.
A Data Point, Not a Destination
One quarter of strong data does not resolve the structural challenges facing Australian construction. The housing supply shortfall remains significant. The skilled workforce pipeline remains a long-term concern. Planning and approvals processes in most states continue to create friction and delay.
What the December 2025 ABS figures do confirm is that building activity is growing, that the trend is real, and that residential construction in particular is moving in the right direction.
For builders, that is useful context. Not a reason to overextend, but a reason to be engaged, to plan ahead, and to position the business to take on good work in a market that is strengthening.
The next release covering March quarter 2026 activity is scheduled for 27 May 2026. That will provide an early read on whether the momentum in the December data has continued.
Source: ABS Construction Work Done, Australia, Preliminary, December Quarter 2025, released 25 February 2026.
More Home Builder news: House Approvals Top 10,000 for Third Straight Month, a Milestone Not Seen Since 2021
General Information Disclaimer:
The content published by The Good Builder is intended for general informational purposes only. It does not constitute legal, financial, or professional advice. Readers should seek independent advice before making decisions based on the information provided.

Author: TGB Editorial



0 Comments